-
- Trading Platforms
- PU Prime App
- MetaTrader 5
- MetaTrader 4
- PU Copy Trading
- Web Trader
- PU Social
-
- Trading Conditions
- Account Types
- Spreads, Costs & Swaps
- Deposits & Withdrawals
- Fee & Charges
- Trading Hours

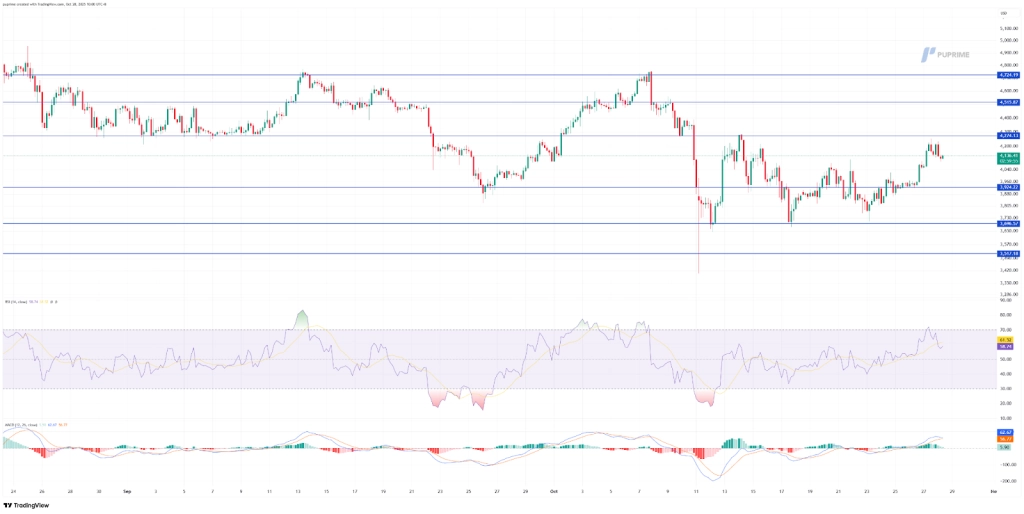
ETH, H4:
Ethereum continues to recover steadily on the chart, extending gains after rebounding from the $3,750 support zone. The pair has broken above the short-term resistance at $3,930, now turning that level into a potential support base. However, price action shows some hesitation below the $4,275 ceiling, suggesting the current move may be entering a consolidation phase before the next decisive push.
The broader structure remains cautiously bullish, as ETH trades above both its 20- and 50-period moving averages, which are now sloping upward showing a sign of improving momentum. Still, the rally has yet to clear the $4,275–$4,515 resistance zone, which coincides with a prior supply area and could attract short-term profit-taking.
On the momentum front, RSI sits around 61, cooling slightly from overbought territory indicating that buyers may be pausing rather than exiting. Meanwhile, the MACD remains in positive territory with the signal line above zero, reinforcing the medium-term bullish bias though showing signs of flattening momentum.
Resistance Levels: 4275.00, 4515.00
Support Levels: 3925.00, 3695.00

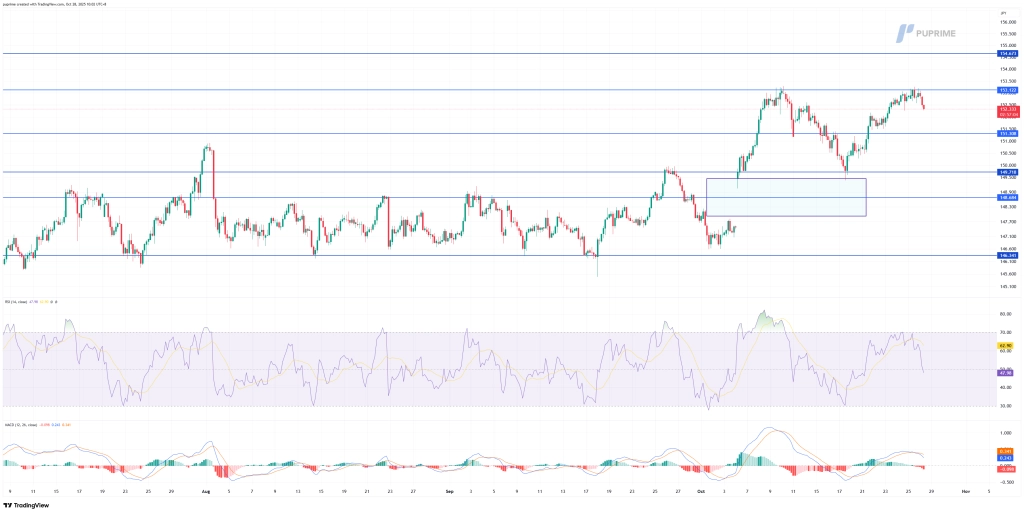
USDJPY, H4
USD/JPY is showing signs of mild consolidation on the chart after a strong rally that lifted prices toward the 153.10 resistance zone. The pair recently faced rejection near this level and is now easing slightly, suggesting that short-term bulls may be taking profits after the sharp leg higher. Despite the current pullback, the broader uptrend remains intact, supported by higher highs and higher lows across recent sessions.
Price is currently hovering around the 152.70–153.00 area, with immediate support seen near 151.30 which is a level that previously acted as both resistance and breakout confirmation. A sustained move below that zone could encourage deeper retracement toward the 150.30–149.70 demand area, where the prior base formed before the latest rally.
From a momentum perspective, the RSI has retreated from near-overbought territory and now sits around 52, suggesting cooling bullish momentum but no clear reversal yet. Meanwhile, the MACD histogram is narrowing, and the signal lines appear poised for a potential bearish crossover, hinting at a possible short-term correction.
Resistance Levels: 153.10, 154.70
Support Levels: 151.30, 149.70

Trade forex, indices, metal, and more at industry-low spreads and lightning-fast execution.
Sign up for a PU Prime Live Account with our hassle-free process.
Effortlessly fund your account with a wide range of channels and accepted currencies.
Access hundreds of instruments under market-leading trading conditions.
Please note the Website is intended for individuals residing in jurisdictions where accessing the Website is permitted by law.
Please note that PU Prime and its affiliated entities are neither established nor operating in your home jurisdiction.
By clicking the "Acknowledge" button, you confirm that you are entering this website solely based on your initiative and not as a result of any specific marketing outreach. You wish to obtain information from this website which is provided on reverse solicitation in accordance with the laws of your home jurisdiction.
Thank You for Your Acknowledgement!
Ten en cuenta que el sitio web está destinado a personas que residen en jurisdicciones donde el acceso al sitio web está permitido por la ley.
Ten en cuenta que PU Prime y sus entidades afiliadas no están establecidas ni operan en tu jurisdicción de origen.
Al hacer clic en el botón "Aceptar", confirmas que estás ingresando a este sitio web por tu propia iniciativa y no como resultado de ningún esfuerzo de marketing específico. Deseas obtener información de este sitio web que se proporciona mediante solicitud inversa de acuerdo con las leyes de tu jurisdicción de origen.
Thank You for Your Acknowledgement!